

0.5p vs 1p Battery Storage: A Practical Design and Procurement Guide?
The 0.5p versus 1p battery choice seems simple, but picking wrong can cripple your project’s economics and safety. Are you judging the decision based on the right numbers?
The best choice isn't about nameplate chemistry. It's about model-specific evidence. Base your decision on the system’s tested C-rate, usable State of Charge (SOC) window, cycle duty, and degradation curves, not just a label like LFP or semi-solid.

I see this question all the time. A buyer gets two quotes, one for a 0.5p system and another for a 1p system, and the conversation immediately jumps to chemistry. But what stands out to me is how easily this decision can be judged from the wrong number. The real question is: What should a buyer conclude about 0.5p vs 1p battery storage? My answer follows one rule: nameplate chemistry is not a substitute for model-specific lifetime and safety evidence. We need to work through the variables—SOC window, C-rate, cycle duty, and the actual cell chemistry—to see how each one changes cost, performance, or risk for your specific project. This guide will show you how to do that, using transparent reasoning instead of guesswork.
Reframing 0.5p vs 1p Battery Storage as a Measurable Decision?
Choosing between 0.5p and 1p feels like a guess. It's easy to get lost in chemistry claims and miss the real performance drivers that impact your bottom line.
Reframe this as a measurable cost-benefit analysis. A 0.5p system might seem cheaper upfront, but a 1p system could deliver a lower lifetime cost per kWh if its usable energy, cycle life, and degradation rate are superior under your specific operating conditions.
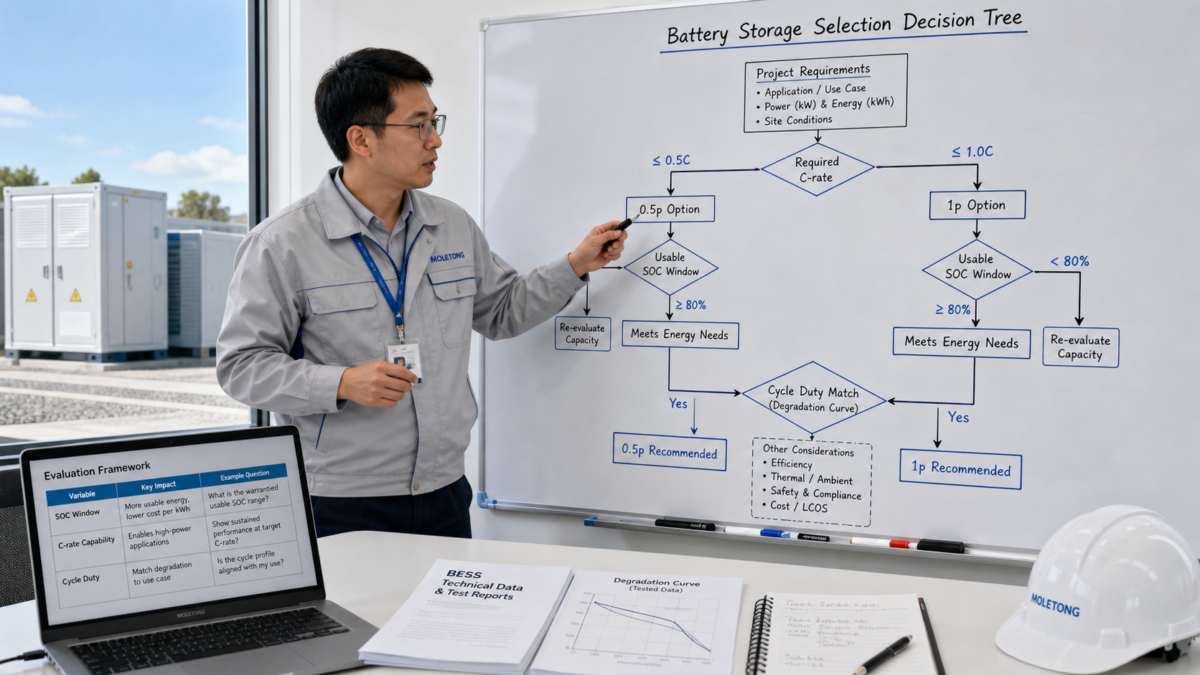
The first step is to stop thinking in terms of generic labels. I recently worked on a project where the client was offered a "next-generation semi-solid" 0.5p battery and a "standard LFP" 1p battery. The marketing for the 0.5p system was fantastic, but the model-specific data was thin. We had to push the discussion past the marketing and into the measurable details that actually define performance and cost over the asset's life. We broke it down using a simple framework to compare the two options on equal footing, looking at how each technical variable influenced the final Levelized Cost of Storage (LCOS). It's not about which chemistry is "better" in a lab; it's about which system performs better for your application, as proven by data.
Key Performance Variables
The choice impacts more than just the initial price. Each variable has a direct effect on lifetime value.
| Variable | How it Changes the Decision | Example Question to Ask |
|---|---|---|
| SOC Window | A wider usable SOC window means more delivered energy per cycle from the same nameplate capacity, lowering the effective cost per kWh. | What is the warrantied beginning-of-life and end-of-life usable SOC range for this specific model? |
| C-rate Capability | A higher C-rate allows for faster charge/discharge, which can be critical for capturing revenue from frequency regulation or peak demand shaving. | Does the test data show sustained performance at the required C-rate without excessive heat or degradation? |
| Cycle Duty | A system designed for one deep cycle per day may degrade rapidly if used for multiple shallow cycles, affecting its suitability for ancillary services. | Is the degradation curve based on a cycle profile that matches my intended use case? |
The Data Needed to Evaluate 0.5p vs 1p Battery Storage Without Guesswork?
You're asked to approve a multi-million dollar battery asset based on a datasheet. How can you be sure the performance claims are real and not just marketing talk?
Move beyond the datasheet. You need model-specific test reports (like IEC 62619), a transparent degradation curve showing capacity fade, temperature performance data for your climate, and a clear traceability record from cell to system to prove what you're buying.

I cannot stress this enough: a marketing brochure is not evidence. Real procurement decisions require a paper trail of verifiable proof. When I evaluate a system, whether it’s one of our Moletong models or a competitor’s, I ask for four specific things. First, the full third-party safety and performance test reports. A certificate is nice, but the full report tells you how it performed. Second, the degradation curve from a reputable lab, showing capacity fade over thousands of cycles under conditions similar to my project. Third, specific temperature performance data; a system that works in a mild climate might fail or degrade rapidly in a hot one. Finally, I ask for the traceability record. This proves that the cells in the unit being tested are the same ones that will be in the units I purchase. Without these four pieces of data, you are essentially flying blind and betting your project's success on a supplier's promise.
How Dwell Time Changes the Risk Profile?
Your battery won't be cycling 24/7. It will sit idle, fully charged or empty. This "dwell time" degrades the battery in ways that cycle life numbers don't show.
Dwell time accelerates calendar aging, especially at high states of charge and high temperatures. A cell chemistry that looks good on cycle tests might degrade quickly when held at 100% SOC. This risk must be factored into your financial model, especially for backup power applications.
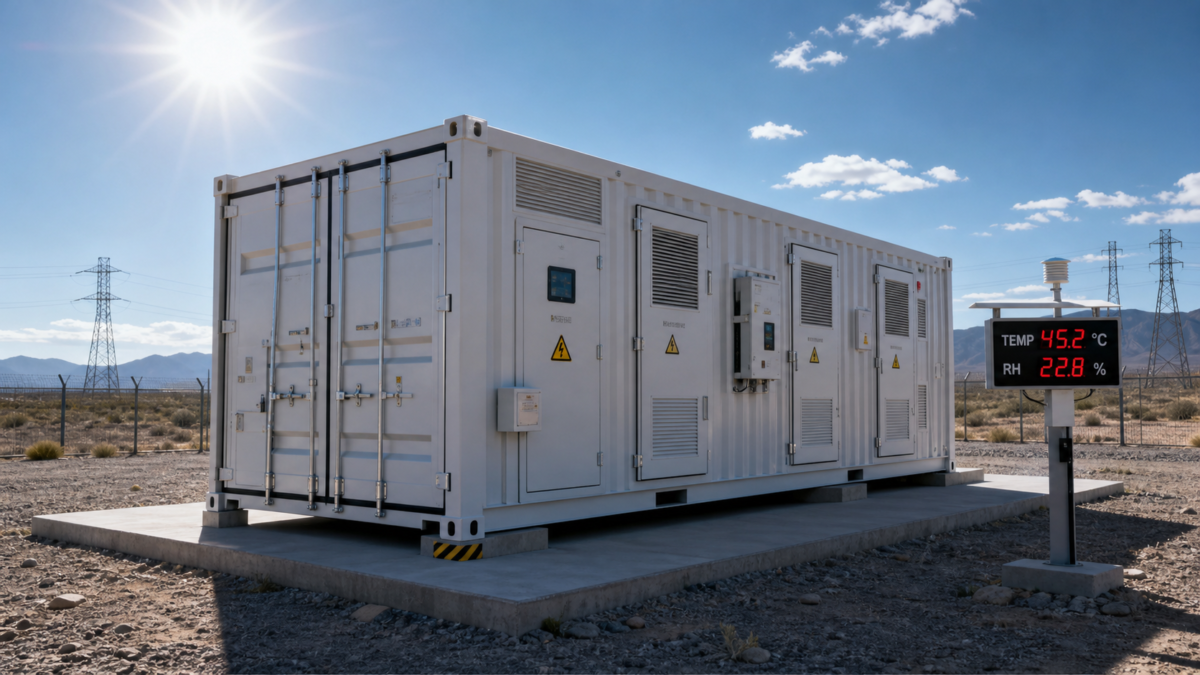
I once analyzed a project for an industrial facility that needed a battery primarily for emergency backup. They were focused entirely on cycle life, comparing two systems based on a 6,000-cycle warranty. The problem was that their battery would likely spend over 95% of its life sitting at a full state of charge, waiting for a power outage. For this application, calendar aging is a much bigger risk than cycle aging. A battery's chemistry degrades just from sitting there, and this process is much faster at high SOC and high temperatures. We had to request specific calendar aging data from the suppliers. One of the options, which had a slightly lower cycle life, showed significantly better stability when held at 100% SOC. Choosing it saved the client from potentially replacing a heavily degraded battery just a few years into its service life, even with very few cycles used.
Final Checks Before Approving 0.5p vs 1p Battery Storage?
You have the data and a preferred model. The contract is ready to sign. What final details could derail the project or expose you to hidden risks later on?
Before approving, verify the test report's applicability to the exact model you're buying. Check that the warranty conditions align with your operational model and the degradation data. Finally, confirm the supplier's traceability records to ensure you receive the same bill of materials that was tested.

This is the last line of defense. After all the technical analysis, a few simple checks can prevent major headaches. I use a "test report applicability table" to cross-reference the model number, cell manufacturer, and even firmware version listed in the test report with what’s on the purchase order. It’s surprising how often they don’t match. Next, I read the fine print of the warranty. Does it exclude degradation caused by the ambient temperatures at my project site? Does it penalize me for the high C-rate my application requires? The warranty must align with the reality of your operations. Finally, I insist on seeing the traceability records. A supplier like Moletong should be able to provide a clear chain of custody for the key components. This isn't about mistrust; it's about ensuring that the system you are buying is the exact same one whose safety and performance were so carefully verified.
Conclusion
The 0.5p vs. 1p decision is won with specifics. Demand model-specific lifetime and safety evidence, not generic chemistry claims, to ensure your project's long-term success.

Leave a Reply