

What Does First Year Battery Degradation Mean for Project Design?
Your project's financial model looks great, but first-year degradation can quickly make it obsolete. You need a design process that anticipates this reality from the very beginning.
First-year battery degradation directly reduces your system's sellable energy capacity, impacting revenue and operational strategy. Proper project design accounts for this initial loss by modeling a downside case, planning for future augmentation, and verifying performance against a transparent cash-flow model, not just catalogue promises.

I see people focus too much on the headline payback number. They get a quote, see an attractive figure, and think the job is done. But the real work is understanding what happens when operating conditions are not perfect. That is where the real risks and opportunities are hidden. When I analyze a project, I start by asking about the risks, not the best-case scenario. This approach helps build a system that is robust and financially sound for its entire life, not just for the first year. Let's dig into what that means in practice.
What is the Real Decision Behind First-Year Battery Degradation in Project Design?
You have to sign off on a BESS project. The numbers on the spreadsheet look good. But you have a nagging feeling that hidden degradation costs will come back to haunt you.
The real decision isn't just about choosing a battery; it's about defining your risk tolerance for underperformance. You must weigh the upfront cost (Capex) against future operational costs (Opex) and potential revenue loss from capacity fade, then build a clear plan to manage that risk.
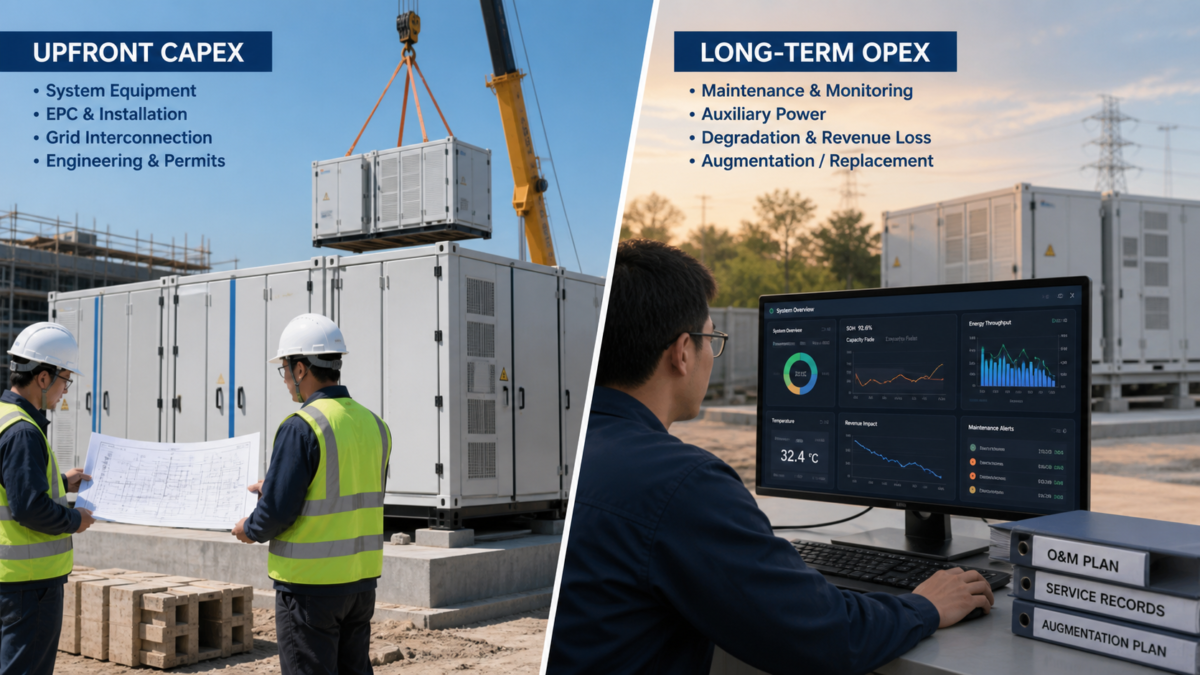
I would never answer the battery degradation question using only catalogue capacity or a simple payback figure. The buyer’s real question isn't "which battery is cheapest?" It is "how do I make sure this project meets its financial target for 10 years?" The answer lies in building a transparent downside case. I always start with the variables that matter most and put them in an assumption register to make everything clear.
Key Variables for Downside Modeling
I use a simple table like this to frame the discussion. It shifts the conversation away from the initial price tag and towards long-term value and risk management. This structure helps everyone on the team see the critical assumptions we are making and how they impact the project's viability under different conditions.
| Variable | Base-Case Assumption | Downside-Case Test |
|---|---|---|
| First-Year Degradation | 2% (from datasheet) | 3.5% (harsher conditions) |
| Auxiliary Load | 1% of throughput | 2.5% (extreme weather) |
| Augmentation Cost | $200/kWh (Year 7) | $250/kWh (Year 5) |
| Discount Rate | 6% | 8% (higher risk) |
This method forces a conversation about risk. It moves the focus from a single, precise-looking payback number to a range of possible outcomes, which is far more useful for making a solid investment decision.
How Do Efficiency Maps and Degradation Change the Answer?
Your financial model probably assumes a constant efficiency figure. But real-world operation is dynamic, and this mismatch between the model and reality can silently eat away at your project's returns.
An efficiency map shows how a battery's performance changes with its power level and temperature. Ignoring it means you will overestimate revenue. When combined with degradation, a system operating in a hot climate or at high power will lose capacity and efficiency much faster than the datasheet suggests.
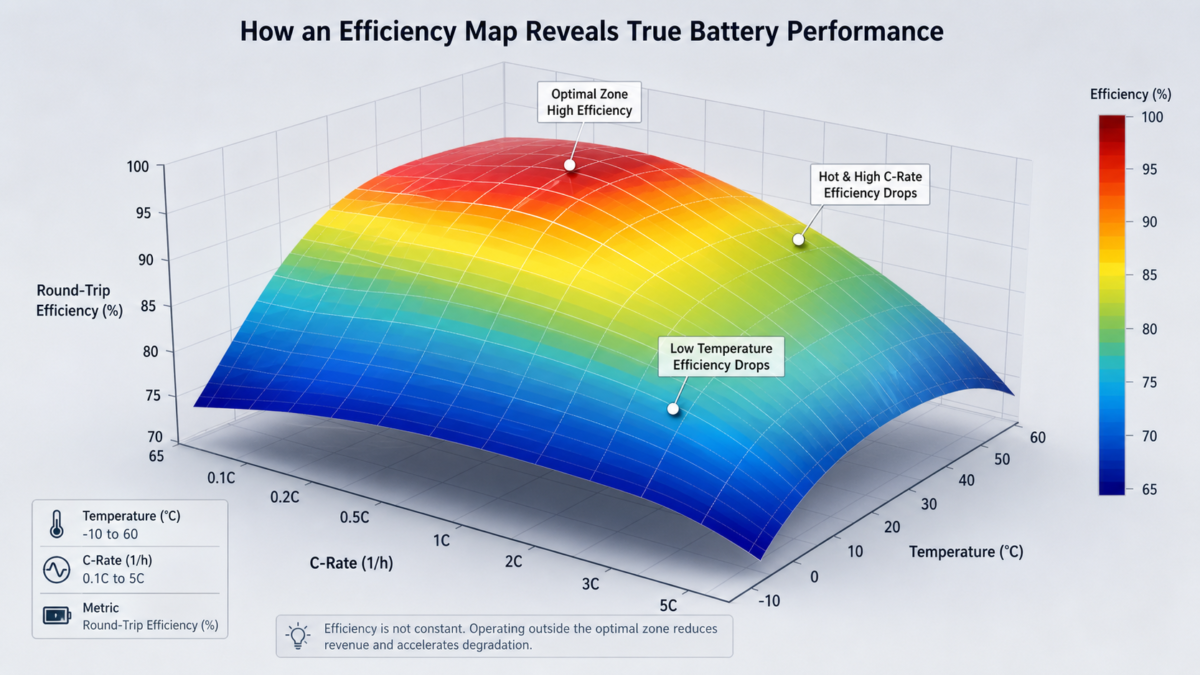
I remember a project where the client was fixated on the round-trip efficiency (RTE) number on the spec sheet. It was a high number, something like 95%. But their project site was in a very hot location, and their use case involved rapid, high-power cycling for frequency regulation. I had to sit down with them and show them the manufacturer's efficiency map. The map clearly showed that at their expected operating temperature and C-rate, the real-world RTE was closer to 88%. That 7% difference was not a small error; it completely changed the project's economics and payback period. When you add the impact of first-year degradation on top of that reduced efficiency, the amount of energy available to sell drops even more. The biggest mistake I see is treating a battery like a simple tank of energy. It is a complex electrochemical system. You have to model how its performance changes under the specific, real-world conditions of your site, not just use the ideal numbers from a brochure. A good design accounts for this from day one.
Where Do Capex and Opex Create Cost or Performance Risk?
A low initial price always looks attractive. But what if it leads to higher maintenance costs, an earlier-than-expected replacement, and significant lost revenue? The cheapest option upfront can easily become the most expensive one over time.
Capex risk comes from overpaying for technology you do not need, while Opex risk comes from under-specifying a system to save money initially. A cheap battery that degrades quickly will need costly augmentation (Opex) much sooner, wiping out any initial savings and creating performance risk as capacity fades unexpectedly.
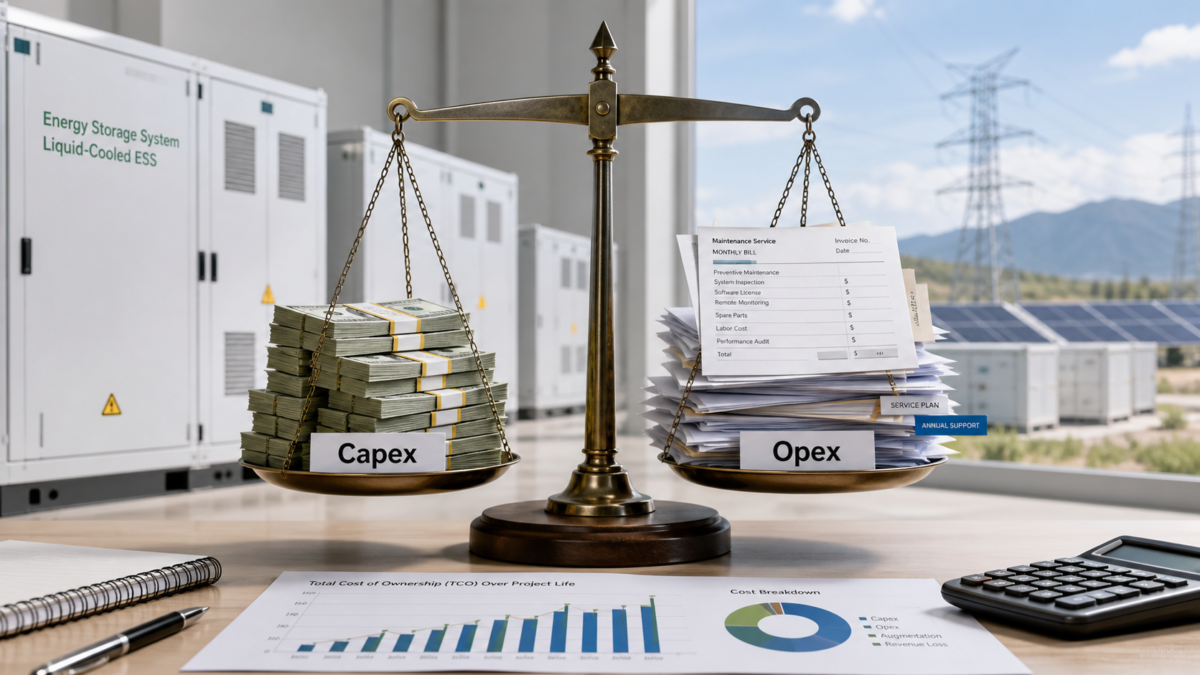
I always tell people to avoid the trap of treating one successful installation as proof that the same design will work everywhere. I once reviewed a proposal that used a low-cost, air-cooled battery system. The vendor pointed to a successful project in a cool, coastal climate as evidence of its reliability. But my client's project was located in a hot, dusty desert environment. The low Capex was very tempting for them. However, I insisted on modeling the Opex based on their specific site conditions. The higher auxiliary loads from the cooling fans running constantly and the accelerated degradation from the extreme heat meant they would need to augment the system in year four, not year eight as their initial model suggested. That future Opex completely destroyed the business case. The risk was not in the initial price. It was in the long-term performance and the future cash flow. You have to connect the Capex to the Opex. A higher upfront cost for a superior liquid-cooled system, for example, might result in much lower degradation and a longer, more predictable revenue stream.
What Should You Verify Before Procurement or Commissioning in a Battery Degradation Cost Model?
You are about to sign a multi-million dollar contract. The financial model looks good, the numbers add up. But can you really trust the inputs? A mistake at this stage could be irreversible.
Before signing, you must verify the model's core inputs. Instead of accepting hard-coded promises, insist on using traceable parameters from the manufacturer, like current Moletong model data. Demand an assumption register, an audit of the interval data, a transparent cash-flow model, and an independent formula review.
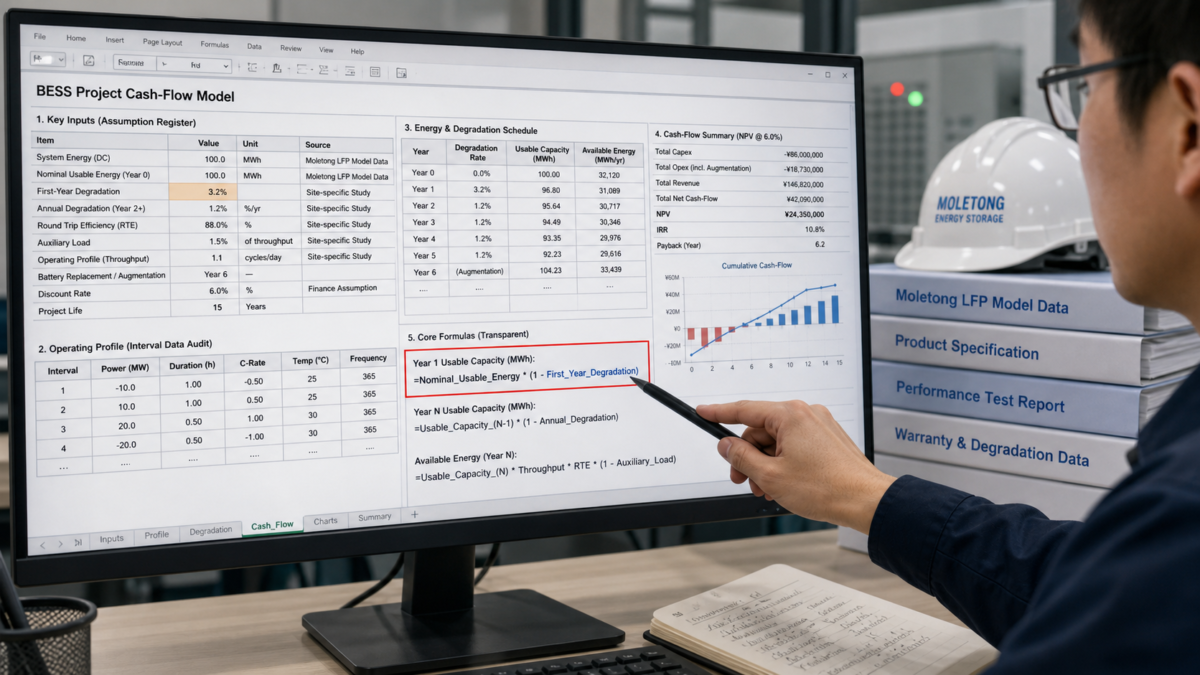
My approach is to make everything transparent. If I were evaluating a Moletong solution, I would insist on using current Moletong model parameters as traceable inputs, not some hard-coded promise in a locked spreadsheet. This is non-negotiable for me. The goal is to give the investor the power to see the assumptions for themselves. I support my recommendation with four key documents. First, an assumption register that lists every single input, from the discount rate to the auxiliary load. Second, an interval-data audit to prove the operating profile is realistic for the site. Third, a completely unlocked cash-flow model so my client can change inputs and see the effect immediately. And fourth, an independent formula review to catch any errors in the spreadsheet logic. This process shows the client the true operating boundary of the system. They can see exactly where and when the answer changes from a "good investment" to a "bad investment." This builds trust and always leads to better, more informed decisions.
Conclusion
A transparent, downside-focused model is your best tool. It turns the complex question of degradation into a clear decision about risk, performance, and the long-term value of your project.

Leave a Reply