

What Causes This Solar Clipping?
Your solar production graph looks great, but then it flatlines on the sunniest days. You're losing valuable energy and money. This is inverter clipping, and it's a deliberate design choice.
Solar clipping happens when your solar panels produce more DC power than your inverter is rated to handle. The inverter intentionally limits, or "clips," this excess energy to protect its components from overload. This results in a flat-topped power production curve during peak sun hours.
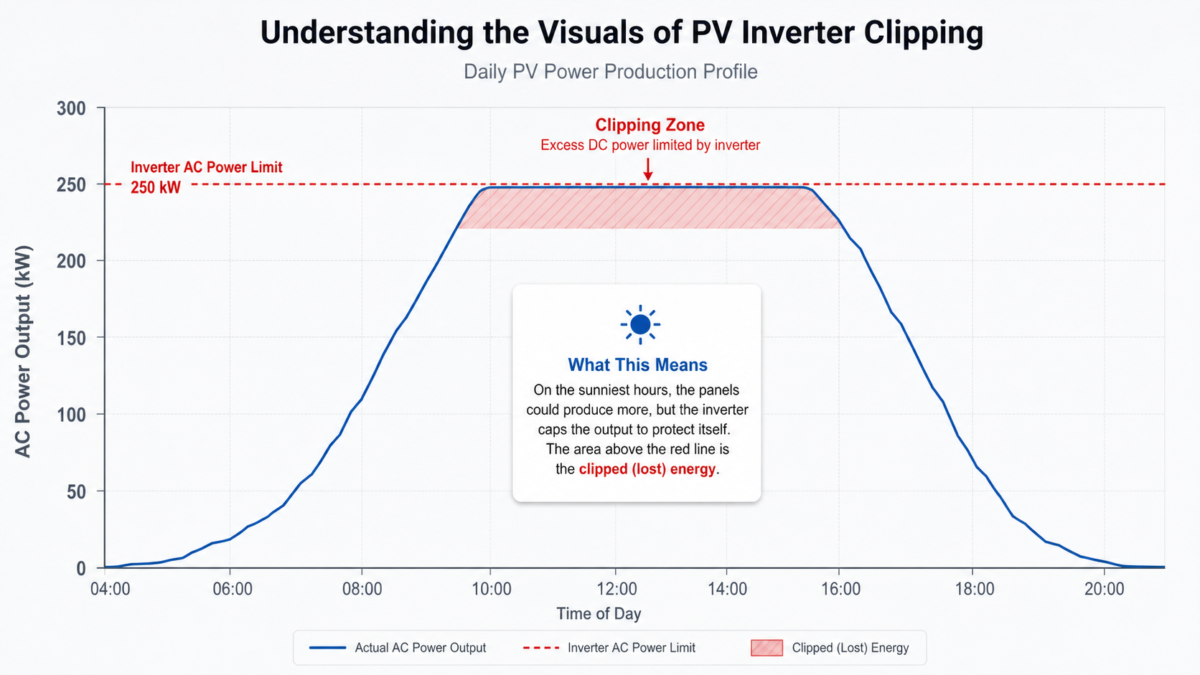
I've seen this issue cause a lot of confusion. The buyer's first question is always about the lost energy. But I never start there. In my experience, the real conversation isn't about the clipping itself. It's about why the system was designed that way in the first place. Answering this question correctly means looking far beyond a product catalog or a simple payback number. A truly optimized solar design isn't finished until we've solved for the grid and local site constraints. Let's dig into what that really means.
Defining Success for PV Inverter Clipping?
Is inverter clipping always a sign of a bad design? You might be fighting to eliminate it, but this could lead you to overspend on your system. True success isn't about avoiding clipping entirely.
Success with PV inverter clipping is not about achieving zero energy loss. It's about finding the economic sweet spot where the cost of a larger, more expensive inverter is greater than the financial value of the small amount of energy that gets clipped on the sunniest days of the year.
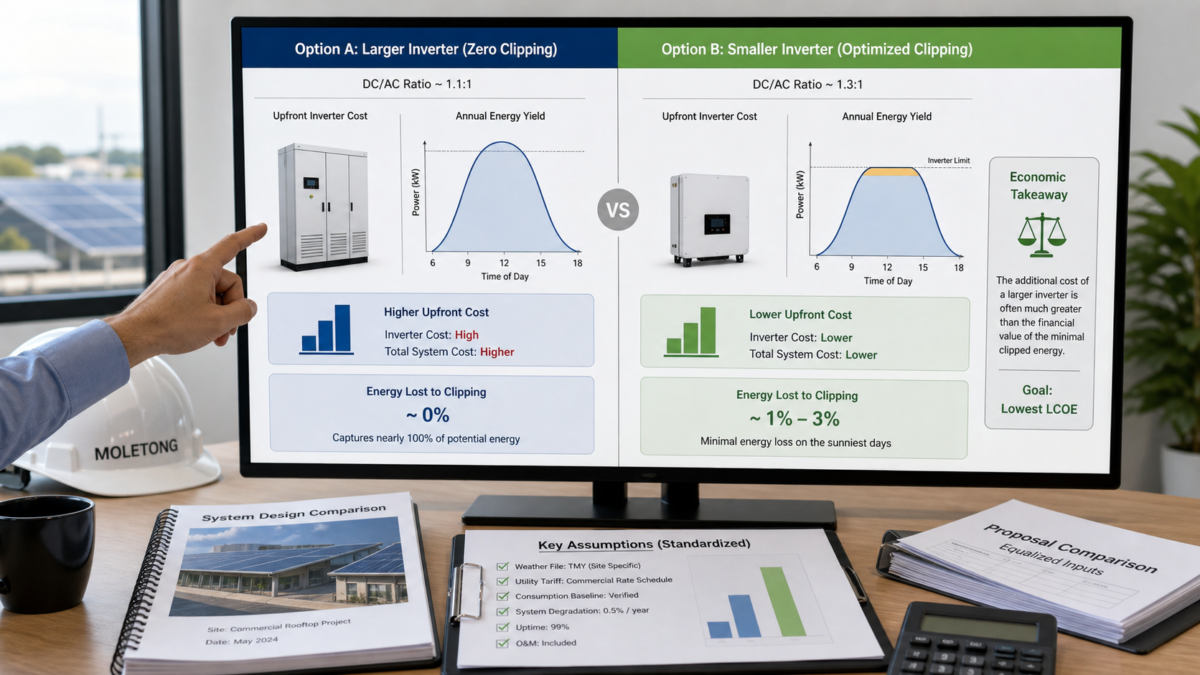
I always tell my clients to think about the Levelized Cost of Energy, or LCOE. This is the total cost to build and operate the system over its lifetime, divided by the total energy it produces. The goal is to get the lowest LCOE possible. Sometimes, a smaller inverter with a little bit of clipping gives you a better overall return on investment than a huge inverter that never clips. This is because panels produce their absolute peak power for only a few hours on a few days each year. Paying for an inverter big enough to capture that tiny sliver of extra energy often doesn't make financial sense.
System Sizing Philosophies
I use a simple table to explain this trade-off. It helps people see the difference between chasing maximum power and chasing maximum value.
| Evaluation Metric | Zero Clipping Approach (Perceived Success) | Optimized Clipping Approach (Real Success) |
|---|---|---|
| Primary Goal | Capture 100% of potential energy. | Achieve the lowest lifetime cost of energy (LCOE). |
| Inverter Size (DC/AC Ratio) | Low (e.g., 1.1:1). Inverter is sized for peak panel output. | Higher (e.g., 1.3:1). Inverter is sized for best economic value. |
| Upfront Cost | Higher, due to the larger, more expensive inverter. | Lower, as the inverter is more efficiently sized. |
| Overall Return | Often lower, because the high initial cost isn’t offset by the minimal extra energy gained. | Often higher, because the initial savings outweigh the value of the clipped energy. |
What Evidence Is Needed to Evaluate PV Inverter Clipping?
A supplier sends you a proposal with a great payback figure from a past project. But that project isn't on your roof or in your climate. Relying on it is a mistake.
To properly evaluate a clipping proposal, you need the complete data package. This includes the site survey, simulation inputs like weather files, interconnection agreements, equipment test sheets, and a clear performance baseline. This evidence reveals the assumptions behind the numbers, so you can trust the analysis.

When I evaluate a project, I refuse to work from a headline number alone. I treat a single successful installation as just one data point, not as proof that the same design will work everywhere. My process is to start from the ground up. I need to see the survey pack to understand the physical reality of the site. I demand the simulation inputs to check the weather data and shading analysis. I ask for the interconnection register to confirm what the utility has actually approved. And I want to see the performance baseline to understand how the system is expected to degrade over time. If I were looking at a Moletong solution, for example, I would start with Zhongwei’s published EPC cases and the real Moletong electrical product specs. I would never invent savings. By putting all this data on the table, anyone can see the assumptions, the operating boundaries, and the exact point where the answer might change.
The Trade-Off Between Protection and Utility Process?
You've designed a system that seems perfect on paper. But the local utility has strict rules and a slow approval process. Your perfect design might never get connected to the grid.
The most critical trade-off is between the maximum power your system can generate and what the local utility will allow you to connect. This is governed by grid protection requirements, local transformer capacity, and the formal interconnection process. Your design is incomplete until the grid constraints are solved.
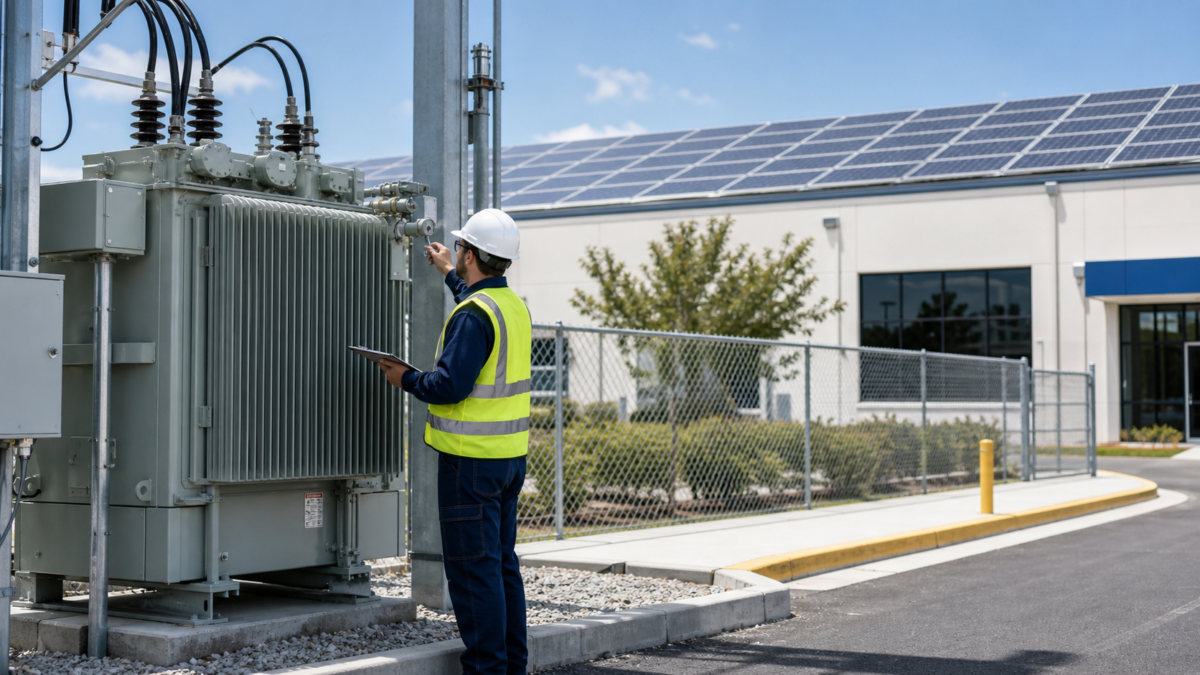
I always begin my design process by looking at the grid connection first. Protection, transformer capacity, and the utility's baseline requirements are my starting points. A design is just a theory until it has an approval to operate. I’ve seen projects get delayed for months or even canceled because the proposed system was too large for the local transformer, or it didn't meet the utility's protection standards. These aren't minor details; they are fundamental constraints that define the project's entire scope. You have to work within the utility's rules. This means understanding their process, providing the correct documentation, and designing a system that supports grid stability, not one that threatens it. This is where having a partner who understands complete electrical systems, not just solar panels, is so valuable. We can close these gaps before they become expensive problems.
How to Compare PV Inverter Clipping Proposals on Equal Terms?
You're looking at two proposals, and they both promise great returns. But the numbers are based on different assumptions, making a true comparison impossible. You need a way to level the playing field.
To compare proposals on equal terms, you must force them to use the same core assumptions. Provide all bidders with a standard weather file, a single set of utility tariffs, and your own consumption baseline. Then you can fairly evaluate their designs and claimed performance.
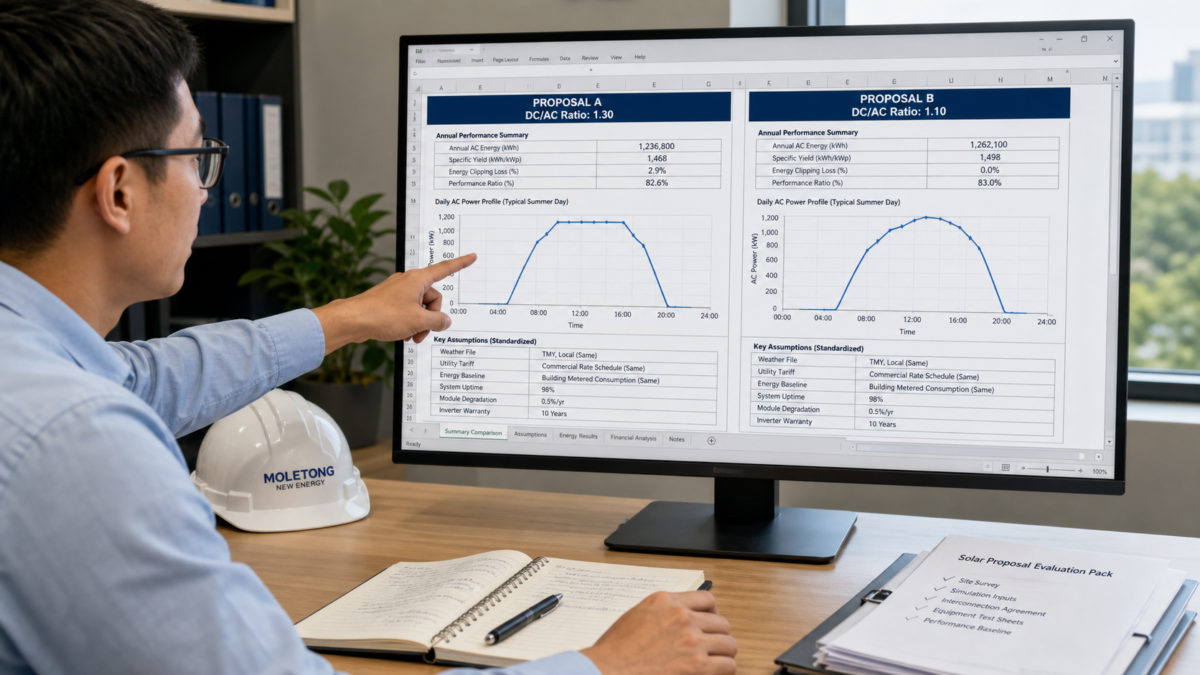
When I'm hired to review competing bids, the first thing I do is create a master assumption sheet. I don't let vendors use their own favorite weather data or optimistic electricity rate forecasts. I standardize everything. We use one location-specific TMY (Typical Meteorological Year) weather file. We use one defined utility rate schedule. We use one verified baseline of the building's energy use. Only then can we compare the hardware and design choices. I dig into the details. What panel degradation rate are they using? What's their assumption for system uptime and maintenance? What are the specific limits from the interconnection agreement? I support my final recommendation with a full data pack showing all the inputs and test sheets. This lets the client see exactly how the conclusion was reached and the point at which a different assumption would change the outcome.
Conclusion
Analyzing solar clipping is not about a single payback number. It's about a complete design process that starts with the grid, respects site-specific constraints, and is verified with transparent evidence.

Leave a Reply